
This is the next article from the SQL series that we at devtodev prepared to help you learn SQL in practice. In previous articles, we talked about how to start learning SQL, how to use it to find out the number of active users, how to apply nested queries and temporary tables.
This time we'll try to fill in the empty dates in the chart and form a distribution histogram.
Log in to your devtodev account and find the SQL Report in the demo project.
Suppose we have to build a chart for an event that appears quite rarely in the app, and sometimes even not once a day. Let's say this is a chart of user purchases from Italy for the last 10 days (from 10/01 to 10/14). The query will look like this:
select eventtime :: date as days
, count() as "Payments count by users from Italy"
from p102968.payments
where eventtime > current_date - interval '14 day'and eventtime < date_trunc ('day', current_date)
and country = 'IT'
group by 1
order by 1
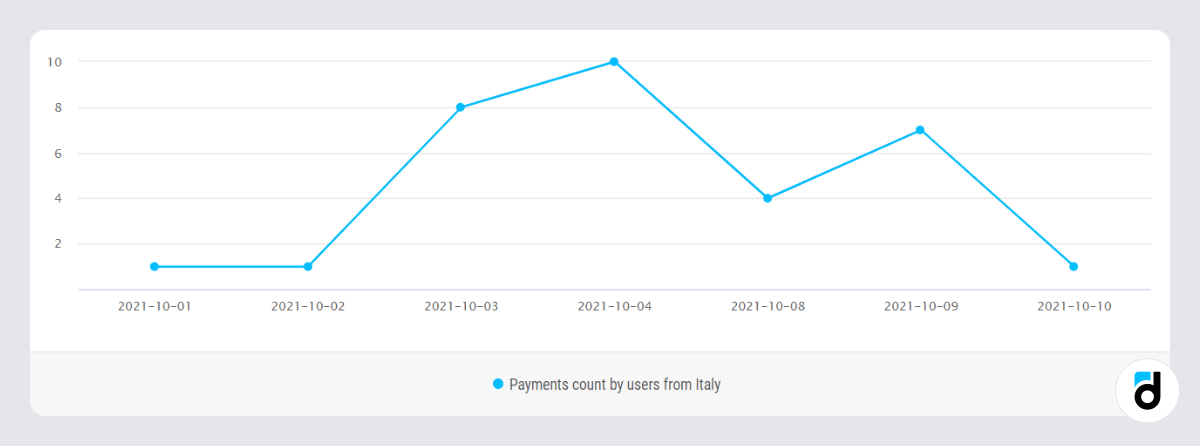
Everything seems to be fine here, but if we take a closer look at the date axis, we will see that some of them are missing. The reason is that there were no payments from 10/05 to 10/07 and the query was unable to group anything in those days. Similarly for dates from 10/11 to 10/14.
Such charts are misleading because it is not always possible to notice missing dates. This most often occurs when a user applies many filters that match a small amount of data. So use generate_series() if you are saving the query in a dashboard and then apply filters.
generate_series for dates
generate_series(start, stop, step) is a function that returns a set of rows and takes two required arguments, start and stop, and one optional, step.
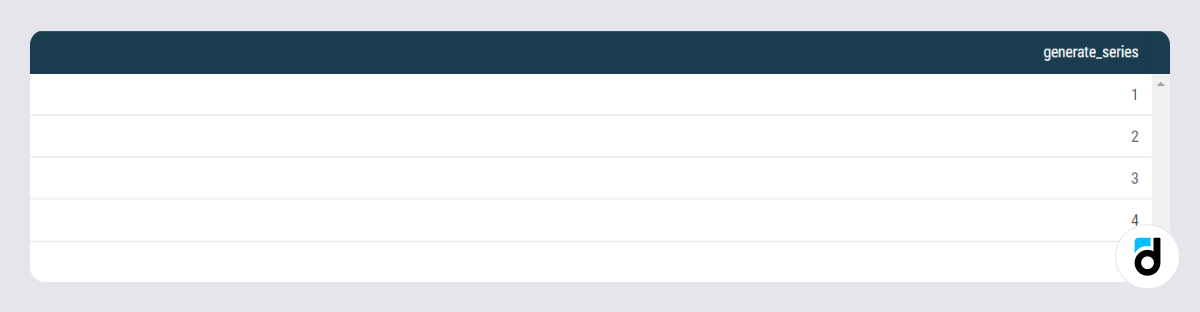
The simplest example of such a function returning a list of numbers from 1 to 5:
select generate_series(1, 5)
In addition to numbers, this function can take dates as arguments and generate a list of dates. When generating dates, always use an interval variable as step.
select generate_series(
ut('2021-10-01')
, ut('2021-10-14')
, '1 day'::interval)::date as days
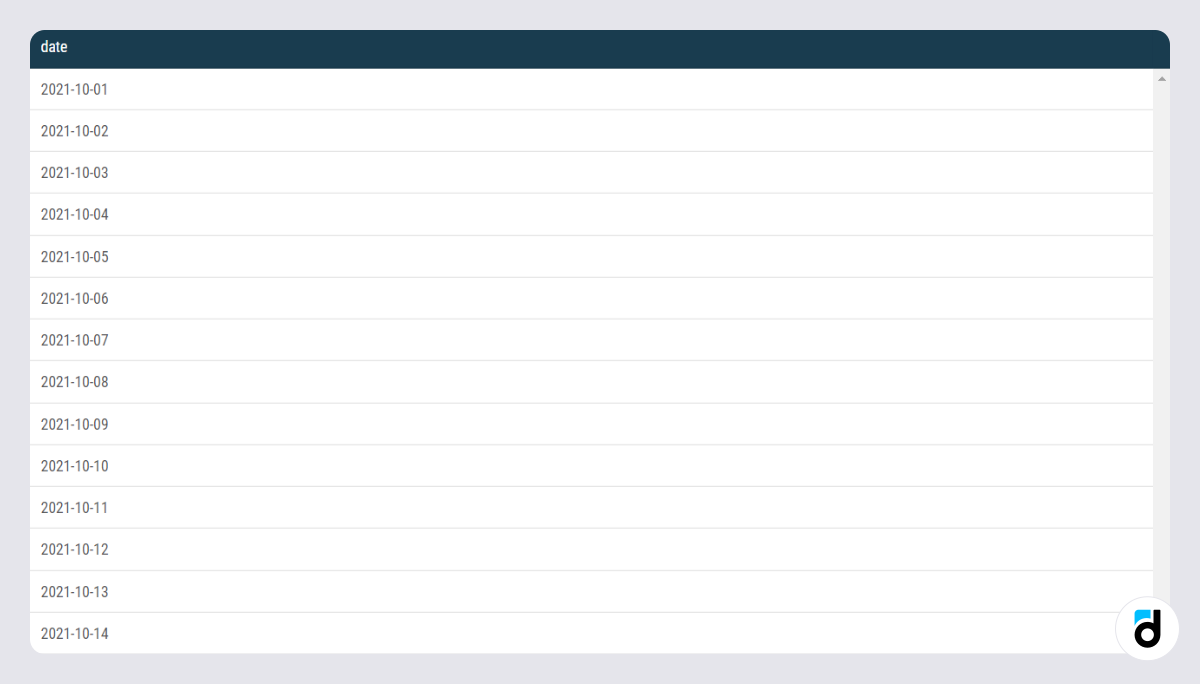
This query returned us all dates from ut('2021-10-01') to ut('2021-10-14') with an interval of one day - '1 day'::interval.
Other examples of generating dates and times:
- 5 minute intervals: select generate_series(ut('2021-10-01'), ut('2021-10-14'), '5 min'::interval)::timestamp
- 1 hour intervals: select generate_series(ut('2021-10-01'), ut('2021-10-14'), '1 hour'::interval)::timestamp
- 1 day intervals: select generate_series(ut('2021-10-01'), ut('2021-10-14'), '1 day'::interval)::date
- Week intervals (notice the use of the date_trunc function as the start and stop arguments. This is to ensure that the generated weeks always start on a Monday, regardless of the current_date): select generate_series(date_trunc('week',current_date-interval '2 week'), date_trunc('week',current_date), '1 week'::interval)::date
- Monthly intervals: select generate_series(date_trunc('month', current_date-interval '3 month'), date_trunc('month',current_date), '1 month'::interval)::date
Empty dates in the chart
In order to use generate_series() in our query, we will separately write date generation in a CTE (Common Table Expression). Then using left join we will add a table with the previously calculated data to the generated list of dates:
with generated_days as (
select generate_series(ut('2021-10-01'), ut('2021-10-10'), '1 day'::interval)::date as days
)
select days, "Payments count by users from Italy"
from generated_days
left join (
select eventtime :: date as days
, count() as "Payments count by users from Italy"
from p102968.payments
where eventtime > current_date - interval '14 day'and eventtime < date_trunc ('day', current_date)
and country = 'IT'
group by 1
) t using (days)
order by 1
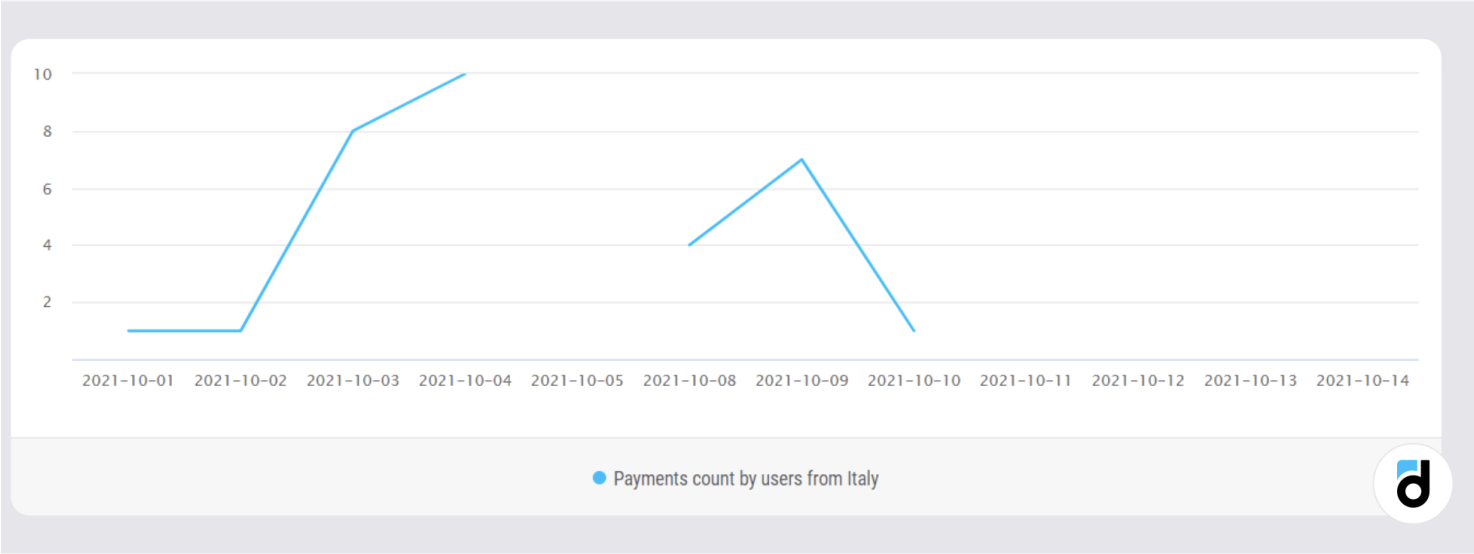
Now the chart has empty, unfilled values for some days, but it is definitely much more truthful. If you want to improve its appearance, you can use the coalesce() function and put a value of 0 for empty fields.
select days, coalesce("Payments count by users from Italy",0)
Building a histogram of ARPPU distribution
Now let's analyze ARPPU – the average income from one paying user. Let's find out what amounts we receive from paying users, and how they can be segmented into "Minnows", "Dolphins" and "Whales".
select devtodevid, sum(priceusd):: int ARPPU
from p102968.payments
where created between current_date - interval '2 month' and current_date - interval '1 month'and eventtime - created < interval '1 month'
group by 1
order by 2 desc
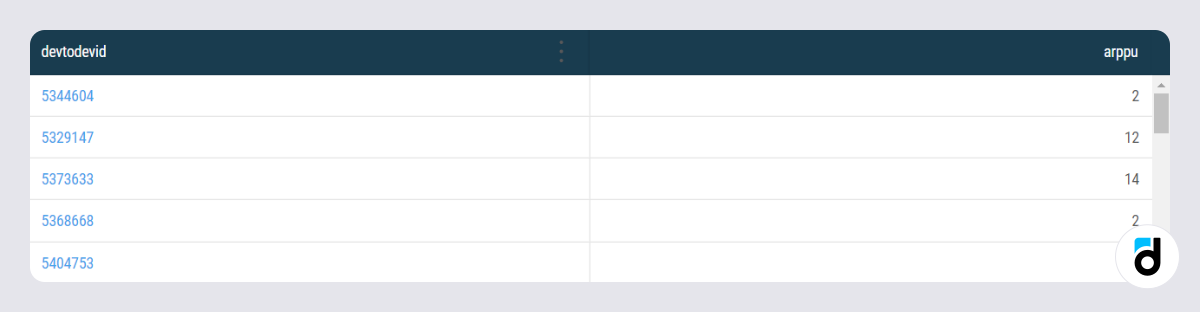
In the where clause, we used eventtime - created < interval '1 month', which returns only payments made during the month after the install. Thus, all users will have equal conditions. We also converted all user payment amounts to the integer value sum(priceusd)::int ARPPU.
with ARPPU_table as (
select devtodevid, sum (priceusd):: int ARPPU
from p102968.payments
where created between current_date - interval '2 month' and current_date - interval '1 month'and eventtime - created < interval '1 month'
group by 1
order by 2 desc
)
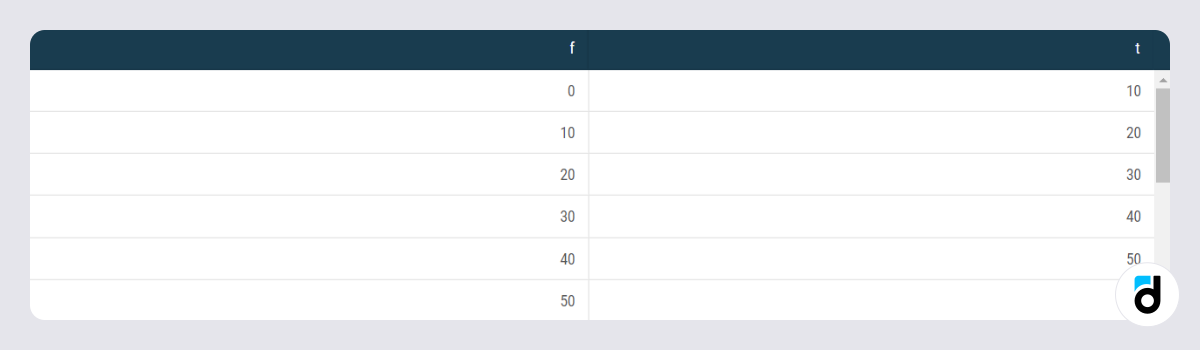
, intervals as (
select generate_series(0, max(ARPPU), 10) as f
, generate_series(10, max(ARPPU)+10, 10) as t
from ARPPU_table
)
It remains to combine the request data. Select data from the intervals table and join the ARPPU_table to it using left join. Let's do this in such a way that each user from the ARPPU_table gets into its own row with the value ARPPU>=f and ARPPU <t. We combined f and t using concatenation, resulting in intervals looking like $0-$10, $10-$20, etc.
select '$' || f || '- $' || t as intervals, count() as "Users count"
from intervals
left join ARPPU_table on ARPPU >= f and ARPPU < t
group by f,t
order by f
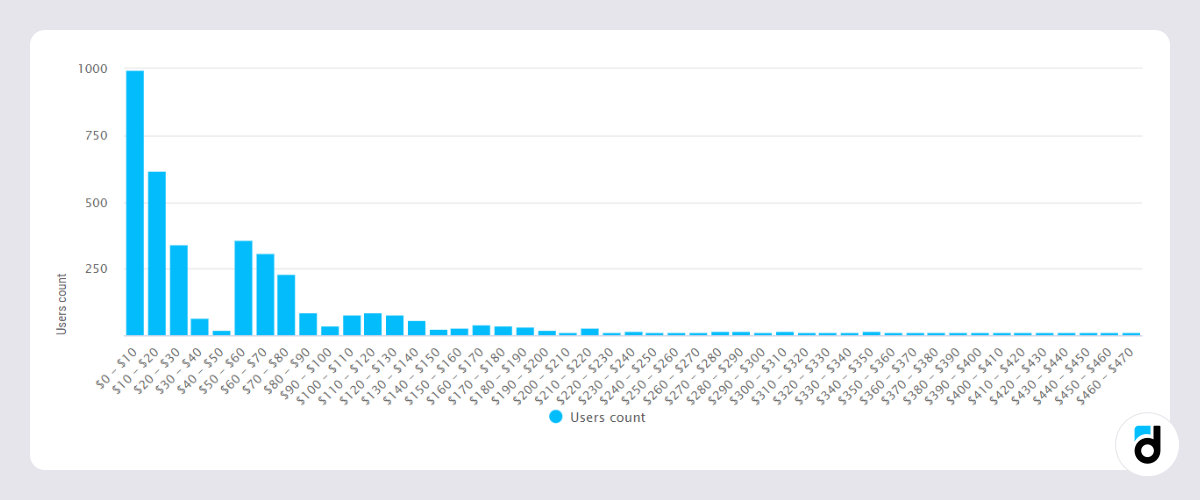
Now you can clearly see how the amounts of user payments are distributed. We can assume that 'Minnows' for this application will be users paying $0 - $10, 'Dolphins' – $10 - $50, and 'Grand dolphins' – $50 - $100, etc.
In this article, we have looked at SQL in regards to filling empty dates in the chart and building a distribution histogram. Next time we will learn how to calculate the share of gross each product brings.


: The Basics")
: The Basics")


 in Mobile Games")
 in Mobile Games")


")
")


")
")


")
")


 Tactics for Mobile Games")
 Tactics for Mobile Games")


