
What is a North Star?
One of the main problems that any product faces during development is coordination among team members who strive towards a common goal.
North Star is a metric that companies use to shape their long-term development strategy. It is a success indicator for the entire team. It provides every fellow with an area of work they have to contribute to.
North Star is also a reflection of the benefit that your company offers to its clients. The benefit taken in the form of a quantitative indicator that you can measure. For Airbnb it is, for example, the number of booked nights, for Miro - the number of active whiteboards, for the FLO app - premium MAU, for Zoom - the number of daily meetings, for Spotify - total consumption time, for Slack - the number of messages within one team, for Facebook - DAU.
Pros of the North Star
1. Promotes Client Orientation
The main benefit of having a North Star metric, assuming you chose the right one, is that you strive to meet your customers’ needs. Companies put the most effort into making the client benefit from their product that, in turn, will boost their profit in the long run.
2. Makes You Focus on the Main Goal
Another benefit is that the North Star metric improves teamwork and allows all the team members to see their shared goal and individual goals clearly.
3. Makes it Easy to Evaluate Employees’ Performance
One more argument in favor of the metric is that it allows for an easy and transparent evaluation of how well your team does its job.
Cons of the North Star
The choice and implementation of the metric have certain shortcomings.
1. Wrong Indicator
First of all, you risk making a mistake with your choice of metric that may at best result in wasting all the team efforts on it.
Let’s take a look at a couple of examples:
-
Your game’s Noth Star is the number of installs. You and your team do their best to improve this metric, to improve acquisition. But in the meantime, you completely overlook returns, average playtime, number of finished battles, and so on.
-
Another situation. This time your product’s North Star is income. For some time you've managed to meet your monthly goals, but it covered up the underlying problems that involve the current state of your product and its long-term outlook.
Often repeat or recurring payments are larger than the first payment. And if you would work on user retention then your income would not fall and may even significantly rise.
2. Metric’s Obsolescence
The modern market is changing rapidly and it may lead to a situation where your North Star became obsolete. This, in turn, will cause you troubles with task adjustments and your team members will end up wasting the efforts aimed at the obsolete North Star.
3. Innovation and Creativity Restriction
A third major problem with the North Star metric is that people focus on it far too much and they simply stop been inventive, stop inventing new functionality. The metric is growing under the watchful eye of the team, but the product is going nowhere, it just keeps its status quo.
How it Stands Apart from Aha! Moment
Don’t confuse the North Star metric with the Aha! moment - a sudden realization of how you can use the product. They both are tightly connected to the perceived value of your product, but they are not the same.
For Facebook, for example, the Aha! moment comes when a user adds 7 friends during the first 10 days after the registration, but as the North Star, the company uses DAU.
How to Find your own North Star?
The North Star metric is a quantitative assessment of the value that your clients get from your product and to find your own metric, you need to define this value.
In some games, players value pure entertainment, role-play, interaction with other gamers. Don’t forget, however, that the North Star despite not been a financial metric, still need to be somehow related to the revenue of the company. It means that the following metrics will suit you the best:
-
DAU/MAU
-
The amount of time people spend on your product (playtime/usetime)
-
The number of paying users
-
LTV
-
The number of target actions per every user/team, e.g. the number of purchases for a week/month, the number of sent messages, and so on.
The best practice is to choose an unrestricted metric. The d7 retentions, for example, can not be higher than 100%, but the number of purchases is endless.
How to Use the Metric
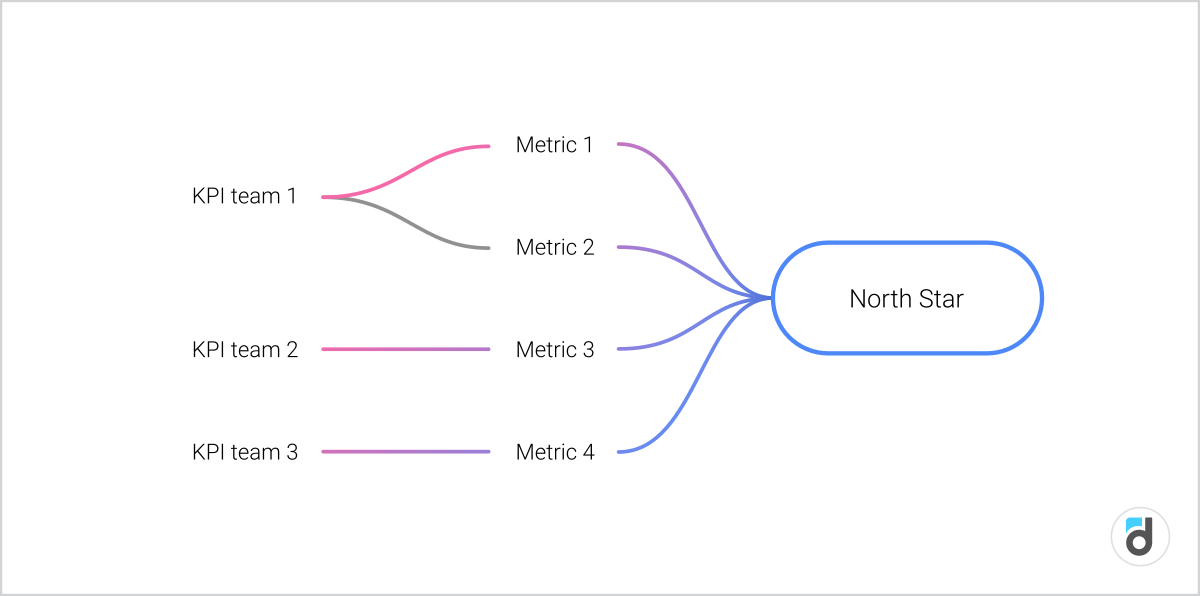
After you chose your North Star, you need to break it down into constituting metrics that will define the responsibility of each department. It means that every separate team will get their own metric or several metrics that are actionable and not purely abstract. If you choose the number of sign-ups as your North Star, for example, then your customer support team will be lost, because they can’t influence this metric directly and therefore they will have no KPIs. It means that you need to define the metrics that influence the number of registrations and, at the same time, partly or entirely depend on the customer support performance.
When you understand the interdependence of these metrics you can define the indicators for each team and can lay down KPIs. If your game is ad monetized, for example, then you need to work not only on user acquisition but also on the average number of ad views per user and the time players spend on the game.
You can picture it as a simple graph:
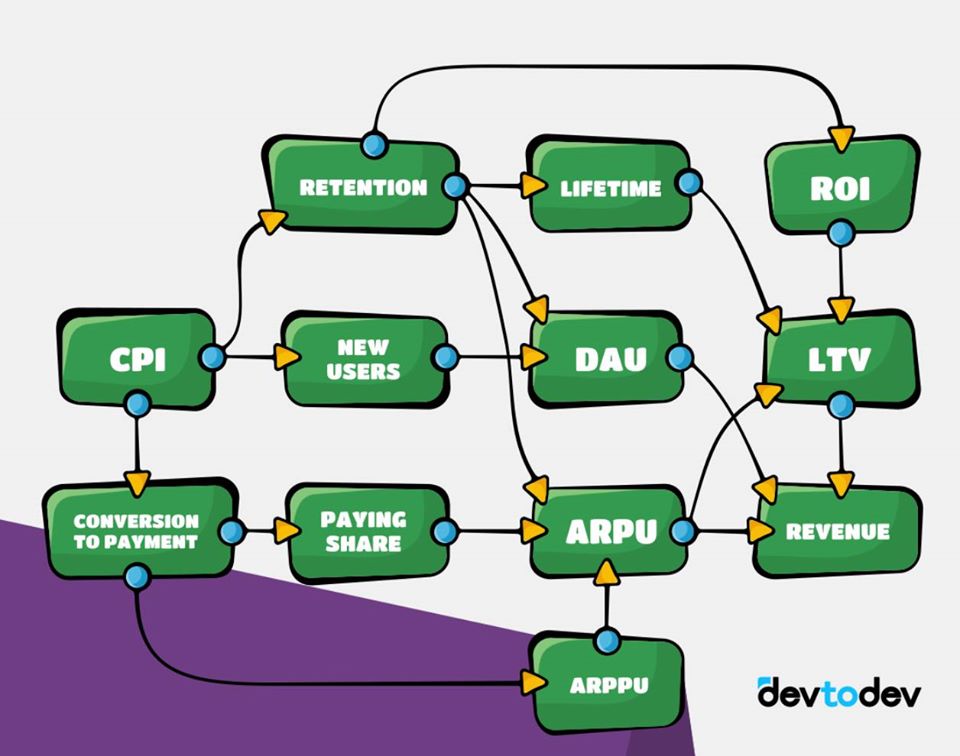
One more example. LTV is often used as North Star because it is influenced by many other metrics which means that all teams will have their fair share of work. If a game has in-apps, then we can break down its LTV as pictured on our map of key analytics metrics: retention, ARPPU, paying share. The teams can work on boosting retention and improving the user action funnel, as well as on the revenue: they can increase the average check and number of purchases, change prices and increase conversion to the first and subsequent purchases, identify the most profitable items, and so on. You can use this metric to lay down KPIs for your traffic buying team too.
If you use ad monetization as a supplementary tool then you can add the following metrics to the list: average number of ad views and sessions per user.
This kind of decomposition helps the team find the metrics that will improve their North Star.
Keep in mind that the North Star metric merely reflects the current state of your product. If you want to identify its growth areas and generate hypotheses, you need to conduct a more detailed and deep analysis of the metrics broken down by cohorts, app versions, sales funnels, and user behavior. All of these you can do using the devtodev analytical platform.


: The Basics")
: The Basics")


 in Mobile Games")
 in Mobile Games")


")
")


")
")


")
")


 Tactics for Mobile Games")
 Tactics for Mobile Games")


