
What mobile app metrics to track if you are new to app development and analytics? First up you need to know that metrics do not exist in a vacuum - all of them are interconnected and influence each other. If you have a sharp decline in one metric value then other metrics may change too - some of them may decline too but some may even grow. But since it’s difficult to understand all interconnections at once we have prepared a list of key metrics to track on an app or game.
What app engagement metrics to track? What about the monetary and acquisition metrics? These are the three parts of the article that we hope will be useful for you.
Get familiar with the metrics and app analytics basics in our free online course.
App Metrics to Track
Monetary metrics
The following list of monetary metrics that you need to keep track of is not complete but rather basic and enough to evaluate how things are going within your app or game.
Gross & Revenue. Most analysts look at more than one form of profit when evaluating app or game immediate or future prospects. These metrics are important simply because they show whether or not the project can keep afloat.
The Gross Profit metric measures the total income received from users over a period of time.
The Revenue metric measures the share of the gross profit that the developer gets.
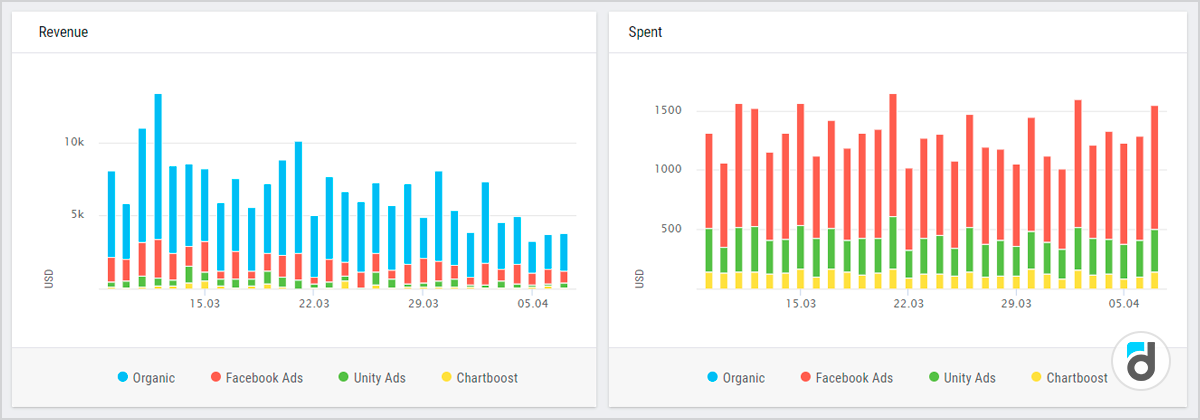
Transactions are at the very core of every analysis. This metric answers the most important business questions: how much did we sell over the chosen period?
Transactions per User - the average number of transactions per user.
Transactions per User = Total Number of Transactions / Total Number of Users
Each day you want your transactions and transactions per user metrics to increase for your revenue to grow.
Average Check Size is an incredibly important metric that is basically the calculation of the average transaction amount.
Average Check Size= Gross Profit / Transactions
Paying Users (aka Premium Users) - the average number of unique users that pay for the service over the selected period (they need to make at least one payment). You need to keep an eye on this metric because these are the people who earn you the profit you are looking for.
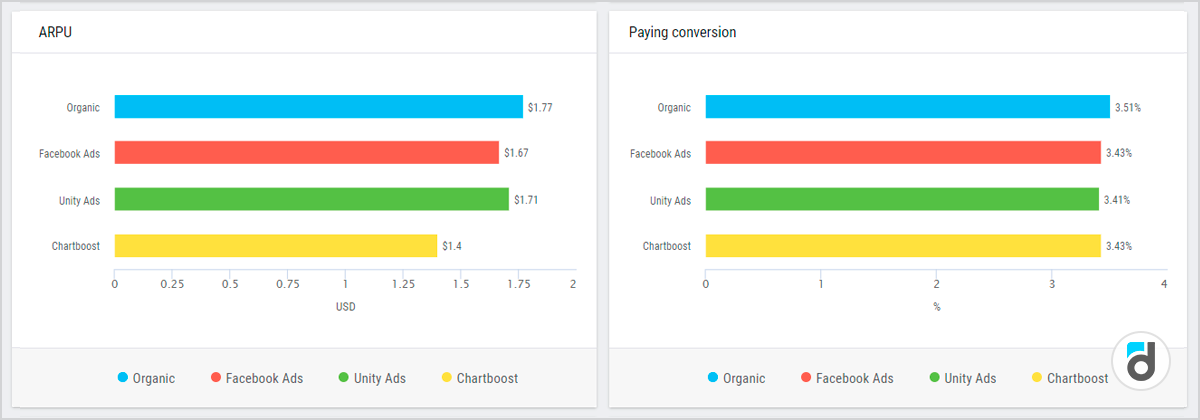
Paying Conversion Rate measures the percentage of people who use your app or game and convert to paying users during the selected period. The higher it is the better.
Paying Conversion = Paying Users / Active Users
ARPU and ARPPU. They are two of the most renowned and widely used measurements of app revenue.
ARPU - Average Revenue Per User, typically calculated over a monthly interval.
ARPU = total revenue earned in a set interval / number of unique users in that interval
ARPPU (ARPMU) - Average Revenue Per Paying User (Average Revenue Per Monetized User). It is also typically calculated over a monthly interval.
You can use these metrics to evaluate if your existing monetization strategy meets the financial goals of the project, or track whether the recent update led to an increase in revenue per user.
Lifetime value (LTV) - average income per user for his whole lifetime in the product. In general, you can use this metric to assess the financial value of each user. It is a very complex measure and you’d better read our dedicated article on it.
Read more: Map of Key Analytics Metrics
Acquisition metrics
Downloads – the number of times your app has been installed from an app store and is the first signal of how your app is doing. Basically, you need to promote your app for more downloads because it will eventually lead to an increase in other metrics.
Total Users – the total number of users who opened your app or game at least once. It is a cumulative metric that calculates the number of users who opened the product from the earliest available date till the chosen date.
New Users – this metric counts the number of new users over time. It is crucial to growing your business because if new users try your app once and never come back, then that means that they are not interested or don’t fully understand it.
Read more: Game Analytics Metrics Glossary
What App Engagement Metrics to Track
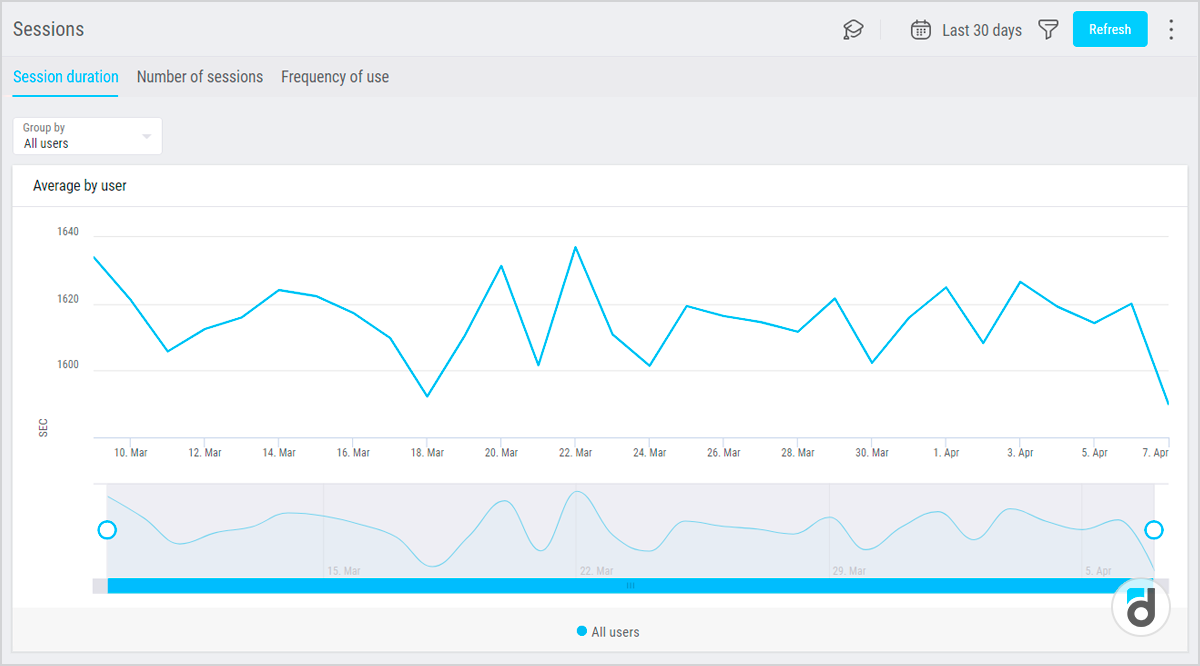
Sessions – are the number of periods when a user is engaged with your app or game over the date range you've selected. A session is counted every time when the user opens the app or game.
Average Session Time measures the average length of a period when a user is engaged with your app or game over the date range you've selected. It illustrates how long users stay in your app or game and indicate the true value of its content.
Average Session Time = total duration of all sessions / number of unique users within a selected period.
DAU/WAU/MAU (daily active users, weekly active users, and monthly active users) – total number of unique users visiting the product daily, weekly or monthly.
DAU is actually an indicator of product health in most apps because they are intended for daily use.
It also shows the growth potential and indicates the stickiness of your product and that’s why investors love it.
Lifetime – the average number of days a user stays active. This metric shows how long your app is able to hold user attention. More about this metric and its calculation methods you can read here.


: The Basics")
: The Basics")


 in Mobile Games")
 in Mobile Games")


")
")


")
")


")
")


 Tactics for Mobile Games")
 Tactics for Mobile Games")


