
The focus of attention of any product creator is always on the people who bring money in - the so-called “paying users''. They need to be treated very carefully and thoroughly studied because you can not do what they strongly disapprove of and should keep them in the product for as long as possible, and you also need to set the stage for new payers.
To take better care of your paying users, you need to understand their needs and this is the focus of a big chunk of analytics. You can analyse many metrics and get a rough picture of what they want. In this article will talk about RFM analysis - one of the ways to learn about users and their needs.
How to do and how to use RMF analysis
Let's start with the definition. RFM stands for Recency, Frequency, Monetary.
Recency - how long ago the user made his last purchase
Frequency - how often the user makes purchases
Monetary - how much the user pays
This analysis is about giving each paying user three scores from one to three. As a rule, they are rated on a three-point scale - "good", "acceptable", "bad", although you can come across (and use yourself) five-point or even ten-point scales.
Here's how scores are assigned using a three-point scale:
R = 1 - a lot of time has passed since the purchase
R = 2 - a little time has passed since the purchase
R = 3 - little time has passed since the purchase
F = 1 - seldom purchases
F = 2 - purchases are made occasionally
F = 3 - purchases are made frequently
M = 1 - the amount of payments is small
M = 2 - the amount of payments is average
M = 3 - the amount of payments is large
And then the question arises, how to assess this remoteness, frequency, and amount? There are some subjective and objective ways to do this:
Subjective expert assessment.
You know your project better than anyone else, and you can set the boundaries yourself. For example, you plan that a user, ideally, should buy something once a week - then this is R=3, if he makes a purchase at least once a month - this is R=2, and if he pays less often than once per month then this is R=1. A lot is $1000 or more for the entire user lifetime in the project, an average is $200-999, and a little is $199 or less.
A more objective assessment is the use of quantiles and quartiles.
Take the same people as in the example above and make a payment column (or just a list) arranging them in descending order. Then (this is subjective) take the top 5% of users and call them “lavish spenders”, then take the bottom 5% and call them “low spenders”. The rest will be "moderate spenders". The same goes for quartiles.
After assigning scores to all your paying users (use Excel or similar programs for convenience), you can proceed to the actual analysis, customer segmentation, and planning actions aimed at increasing your profits.
Read more: App Cohort Analysis
RFM analysis - customer segmentation tool
Using RFM analysis, you can, for example, do the following:
-
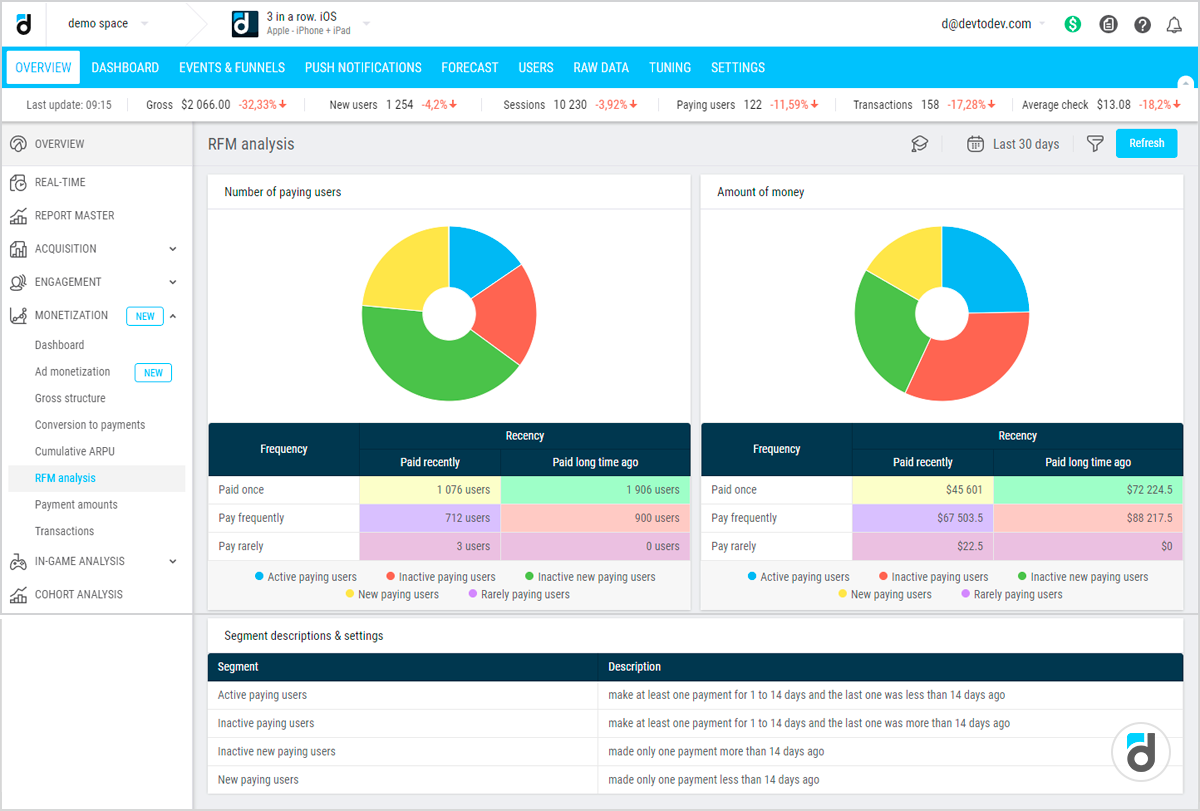
Find new paying users (R=3, F=1). They have overcome the main barrier - made the first purchase, and now you can employ all the marketing strategies that you prepared in advance to ensure that they make the second and repeat purchases.
-
Find loyal users (R=3, F=3). To keep them loyal, you need to show how much you value them. To do this, you can sometimes give them bonuses and gifts with messages of gratitude for supporting the project.
-
Catch loyal users on the verge of leaving (R=1, F=3). You need to keep them in the project - first, try to find out the reason behind their unwillingness to pay and try to deal with it. If identifying the reason is impossible, just remind them about the project, for example, by sending a push notification.
-
Find inactive payers (R=1, F=1). They have already overcome the barrier in the form of the first payment, they still use the product, but for some reason, they do not buy anything else. In this case, you can also try to understand what prevents them from making more purchases and fix it, or you can offer them a super (you may even work for minus here) promotion to encourage them to make another payment and continue using the product.
Watch our webinar on Analytics in Game Development
How to Use RFM Analysis Segments
How can you apply his analytical tool in real life? Let's take a look at a good project that strives to increase profit. The analysts conduct RFM analysis and find out the following:
-
it has loyal users, but their churn rate is quite high;
-
most often, users make only one purchase.
The analytical team studies the reasons why loyal users leave the project, as well as studies paying users who have made a different number of purchases, and determines the point of no return. After that point, a person who made one purchase is most likely not to make another. Later, at those crucial moments, they utilize push notifications or pop-ups and start making fair offers or giving big discounts to this audience. By doing this, they increase the percentage of users who made a repeat purchase and keep their loyal audience engaged.
As you have already noticed, in these examples we used only two of the three parameters - Recency and Frequency. RFM analysis is a rather flexible analysis that you can adjust to your needs, removing some parameters or even adding some (for example, the user count).
Read more: 4 Simple Methods of Paying Audience Segmentation
How to Apply RFM Analysis to f2p Games
In free-to-play games, paying users are often analysed by the total volume of money spent (not by individual payments!). In this case, they are referred to by figurative names:
-
Minnows - low spenders;
-
Dolphins are medium spenders;
-
Whales are high spenders.
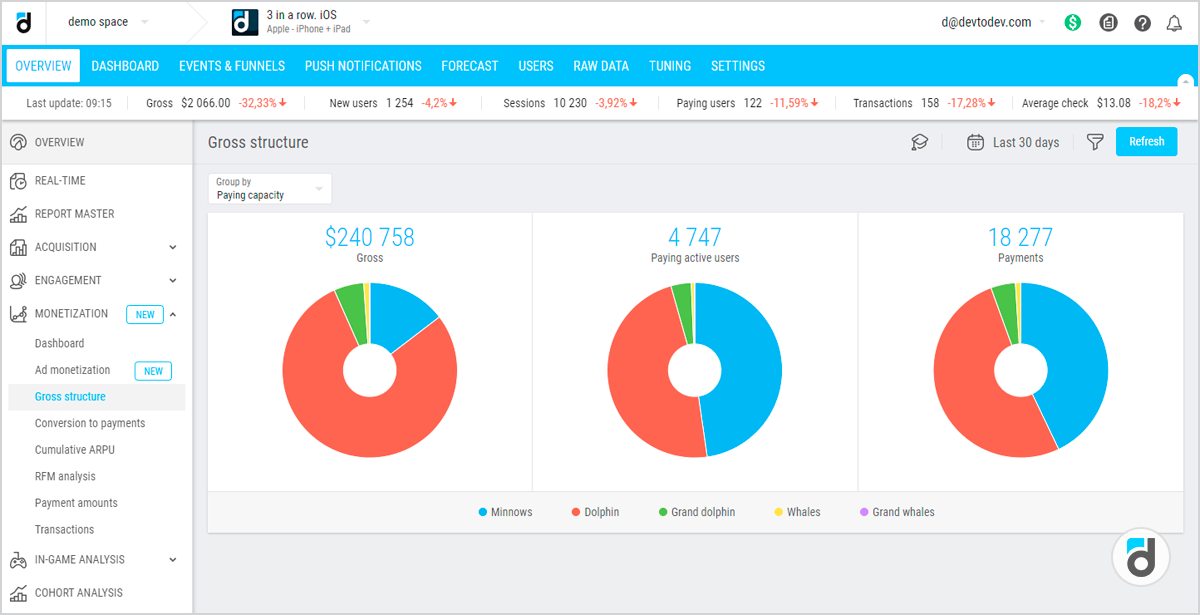
As you can see from the screenshot above, you can also separate large dolphins and large whales. Large dolphins pay more than regular dolphins, but fewer than whales and large whales pay significantly more than regular whales.
In fact, this is the same breakdown by amounts paid, as we have discussed earlier. And the boundaries here are also determined subjectively by you personally or subjectively-objectively with the use of mathematical tools.
This breakdown can be used to understand how many people are there in each segment and how much profit they generate. And, as a result, understand how to increase profits - should you increase or decrease prices, add more items to the store, come up with some interesting mechanics, etc. Based on devtodev expertise, for example, in games, whales and large dolphins usually generate most of the revenue, which means that you need to pay close attention to them and prevent them from “floating away”.
Watch our webinar on Analytics and Monetization in Hyper-Casual Games
Sure, by using RFM analysis you can get only a fraction of the information about your paying users. To get a complete picture, you should use other tools as well.
If you want to see how powerful a modern analytical system is, go to the devtodev demo project.


: The Basics")
: The Basics")


 in Mobile Games")
 in Mobile Games")


")
")


")
")


")
")


 Tactics for Mobile Games")
 Tactics for Mobile Games")


