
Free-to-play games are very popular and financially successful, and we at devtodev keep on working at making them even more profitable while striking a balance between their quality, monetization, and user loyalty. In order to do it effectively, you have to get a good grasp of your income flow. You can apply a number of game analytics metrics and analyze how and when players pay in the game, how much they pay and why they do it, how to retain them and acquire new users.
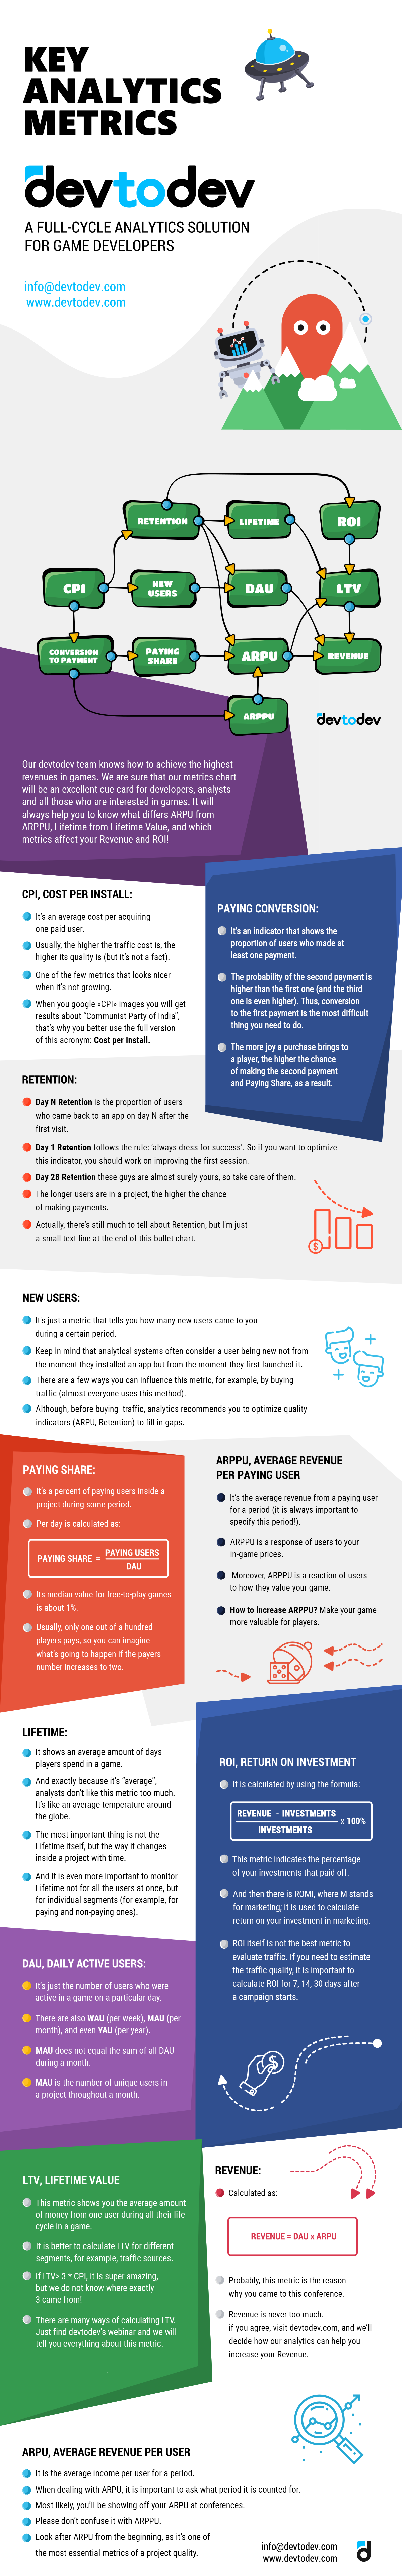
Game analytics metrics map is our way to display interrelation of all components of success and visualize game developers’ and analysts’ way of thinking. Using this cheat sheet you will always find your project’s soft spots and correct them.
Has your income dropped? Take a look at the metrics. Check what caused it. Your audience size and the number of paying users didn’t change. So, does it mean that each paying player bought fewer items? The chart will give you a clue about the metrics you need to check to understand this income decline and how to resolve this situation.
Monitoring and reacting to metrics values changes is important if you want to get a better understanding of how your game functions. Our game analytics metrics map is very convenient for controlling connections and causal relationships. Using devtodev’s metrics map you will see which way the wind is blowing in the game analytics world!
devtodev team wishes you good results!


: The Basics")
: The Basics")


 in Mobile Games")
 in Mobile Games")


")
")


")
")


")
")


 Tactics for Mobile Games")
 Tactics for Mobile Games")


