
Match-3 games have captured the hearts of millions of players around the world with their gameplay and colorful puzzles. But how can game developers ensure that their match-3 game is not only fun, but also profitable?
The primary objective is to convert players into paying users while fostering continuous engagement with the game. Achieving this requires a deep understanding of player behavior, preferences, and spending patterns. By analyzing these indicators, developers can tailor their monetization strategies to effectively engage users and drive revenue.
And this is where devtodev comes in, offering powerful analytics tools for a deeper understanding of player behavior and game performance. With devtodev's analytics platform, developers can gain insights to optimize their match-3 game's monetization strategies and enhance overall profitability.
Match-3 Features to Consider Prior to Conducting Analysis
Before diving into analytics, it is important to understand the features of match-3 games that influence the choice of analysis methods and required reports.
Level Structure. Match-3 games typically consist of multiple levels, each with its own unique challenges. Players progress through these levels, unlocking new ones as they go. At the same time, unlocked levels can be completed several times. For example, if a player successfully completes 20 levels, after level 19, they can go to level 5 or 10, and then return to level 20.
Resources and Bonuses. Players have access to various items and bonuses to help them progress through levels. These bonuses can be received for good results or bought using the in-game currency.
Monetization. In-game currency can be purchased with real money or obtained by watching advertisements, which is a source of revenue for developers.
In addition to key metrics such as New Users, Active Users, Gross, ARPU, and Retention which are crucial for evaluating the performance and engagement of the game, you can track and analyze specific user actions, represented as Custom Events in devtodev.
User Behavior. Analyzing user actions in match-3 games includes monitoring custom events such as interactions with other users, purchasing of specific offers, clicking on an item and so on.
Read more: Game Level Progression
How to Analyze Match-3 Games Using an Analytics Platform
Let's take a look at how devtodev can help you analyze match-3 games.
Distribution of Users by Levels
We can use the Game Structure report to see the current distribution by level, revenue from each level and the share of paying users.
Firstly, let's examine the user distribution across levels. This way we can determine the number of users who have visited each level, and identify where players may be encountering difficulty progressing. This will help us assess the difficulty of the levels.
We'll include the following metrics on the Player Levels tab: Passed the level, Remaining on the level and % of remaining users.
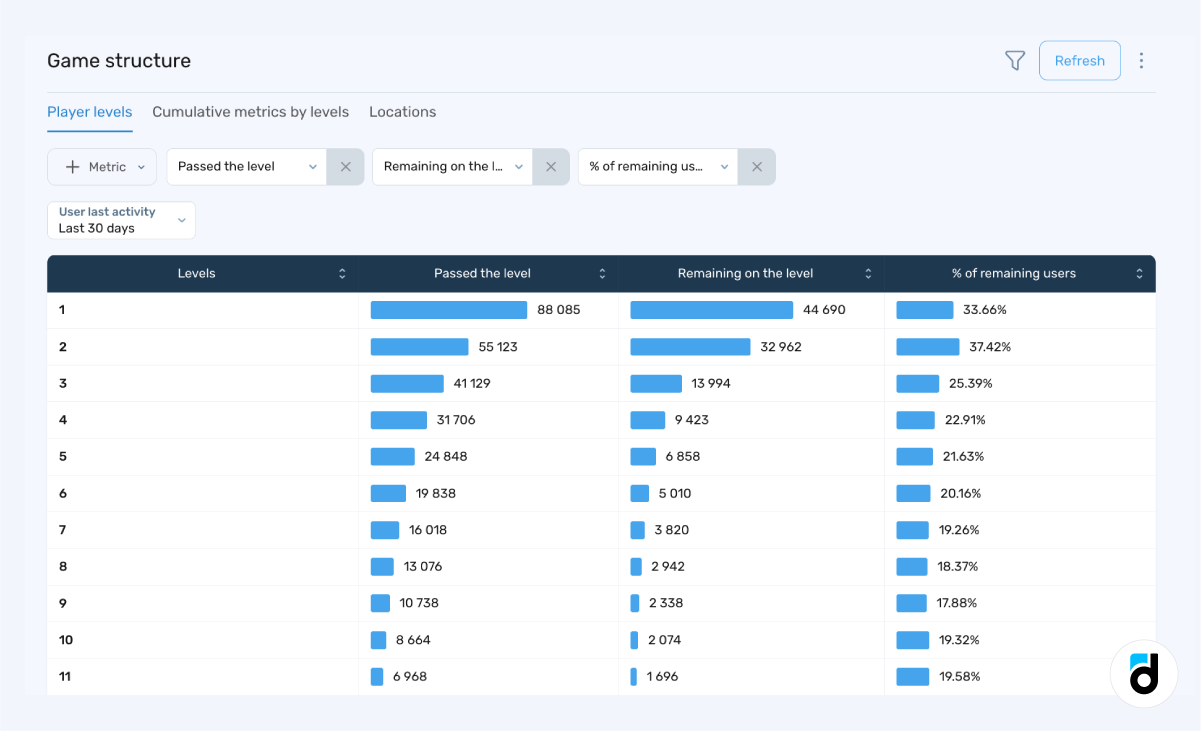
At the first three levels, we observe a drop-off in users of approximately 35%. This decrease is likely attributed to users' lack of interest in the game rather than the level's complexity. We could check out the data from higher levels to see if they're all tough enough to drive users away. After this, we can make adjustments to our game.
By examining the distribution of users across different levels, we can assess the complexity of each level and identify any potential bottlenecks.
Cohort Analysis
Next, we'll analyze the level distribution of two user cohorts who registered in the project at different times. Specifically, we'll examine users who registered one week ago and those who registered two weeks ago. By tracking their progress through the levels over time, we can forecast the expected progression of users who registered one week ago.
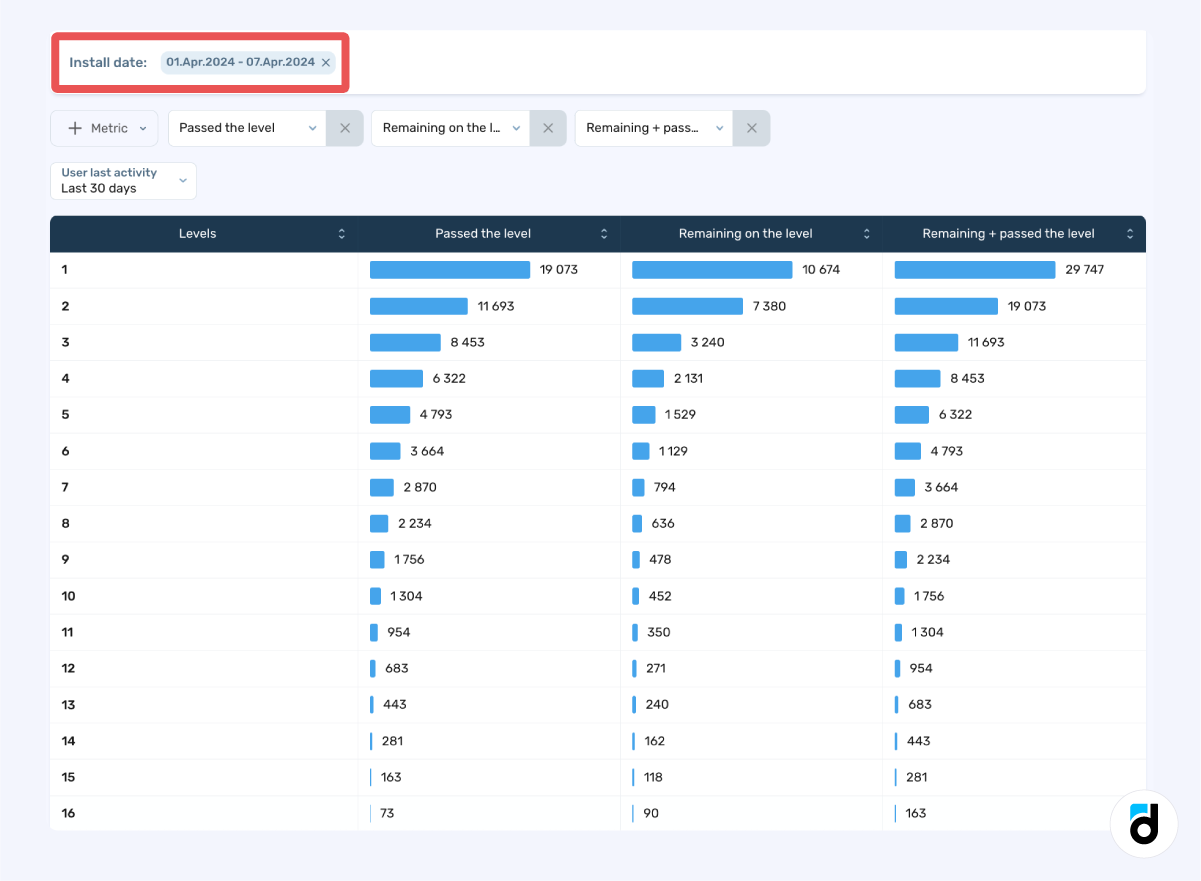
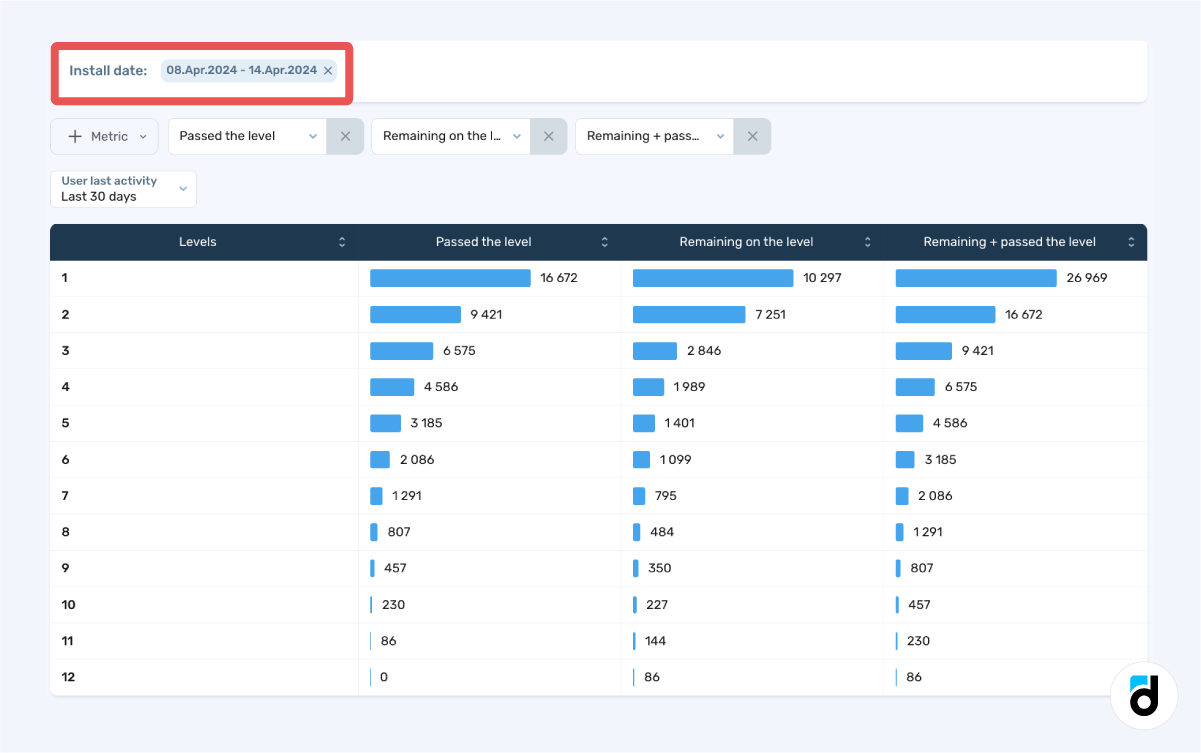
We see that users who registered two weeks ago are distributed across all levels. On the other hand, users who joined last week seem to be concentrated in the middle levels. This may indicate that initial levels could be either too easy for new players.
Additionally, none of the players have reached level 13 yet. This may mean that the difficulty level at this stage of the game is too high for most users, potentially leading to quitting the game.
These conclusions will allow us to better understand user behavior in the game and take steps to improve their gaming experience, ultimately leading to increased user retention and game revenue.
Comparing user cohorts based on registration date allows us to track user progress over time and predict future behavior.
Monetization
On the Player Levels tab, let's select the following metrics: Remaining on the level, Paying share, and Gross.
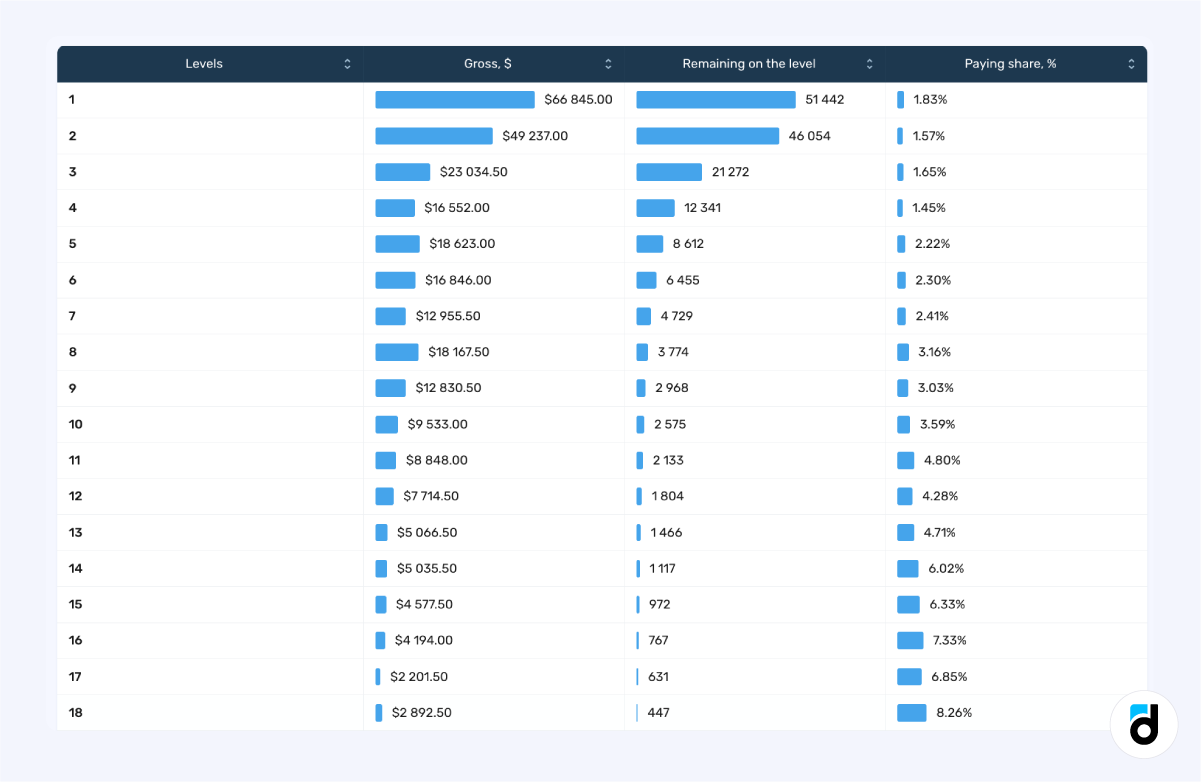
The majority of revenue comes from the initial levels, highlighting the significance of engaging users at mid to high levels. This suggests that retaining players as they progress through the game is crucial for maximizing monetization opportunities.
Additionally, there is a noticeable spike in purchases at level 8, likely attributed to users encountering a special offer and taking advantage of it. This indicates that well-timed and strategically placed offers can significantly boost revenue generation.
Read more: How to Launch a Promo Campaign and Increase Product Revenue
For a more detailed analysis of purchased items, devtodev has the Purchases dynamics and Purchases structure reports (In-game analysis -> Virtual goods & purchases).
Analyzing the revenue generated by each level provides insights into which levels are the most profitable. This information can be used to optimize game design and monetization strategies, focusing efforts on levels where players are most likely to make a purchase.
Location-Based Analysis
Now, let's shift our focus from levels to game locations. We'll switch to the Locations tab and select the following metrics: Audience, % of users passed the location, and Successful attempts.
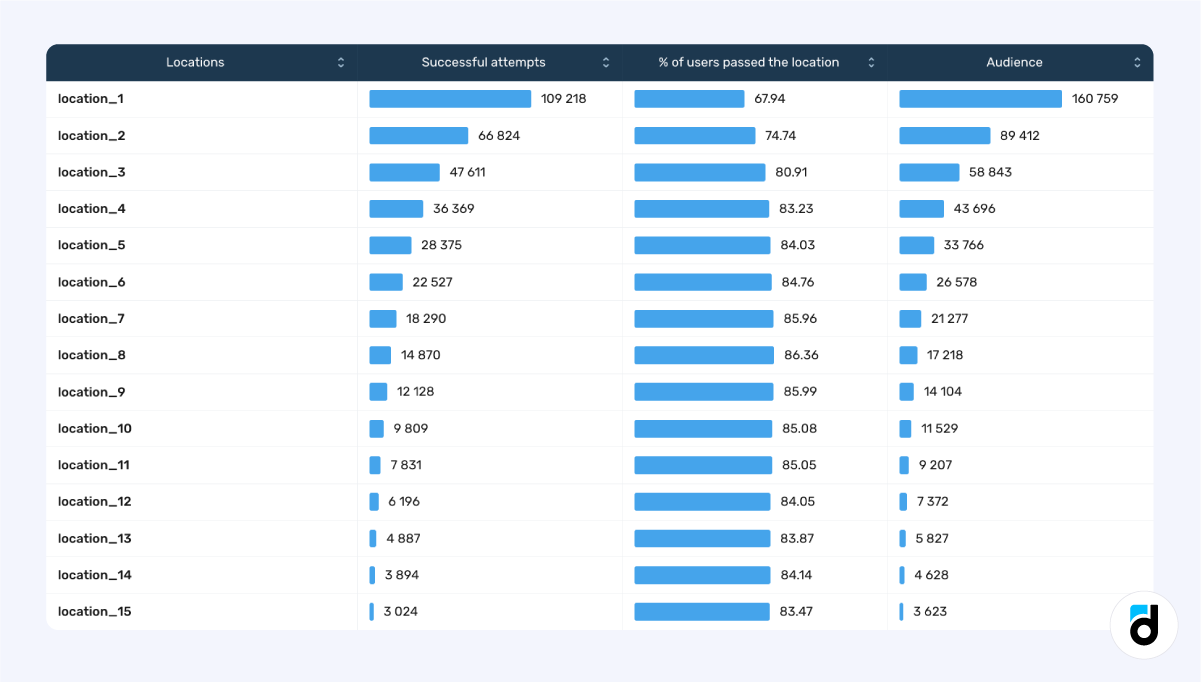
During attempts to complete a level, users may change various numerical indicators such as resources and in-game currency. We can monitor changes in any numerical parameter of the location based on successful or unsuccessful attempts, such as steps, health units, or boosters.
By examining the distribution of players across game locations and their flow within these sections, we can gain insights into user behavior patterns. Understanding how players progress through different locations can help identify areas of interest or potential bottlenecks.
Read more: LiveOps: What are Playable and Payment Events?
Devtodev allows developers to analyze gameplay on a more detailed level by breaking down data into specific game locations. This can help identify areas where players may be struggling or where improvements can be made.
Custom Events
In addition to using preset reports, we can integrate custom events to our project to track and analyze specific user actions. In devtodev, we can use these events to gain insight into how users are playing the game, what quests they accept, how often they interact with each other, what offers they open, and so on.
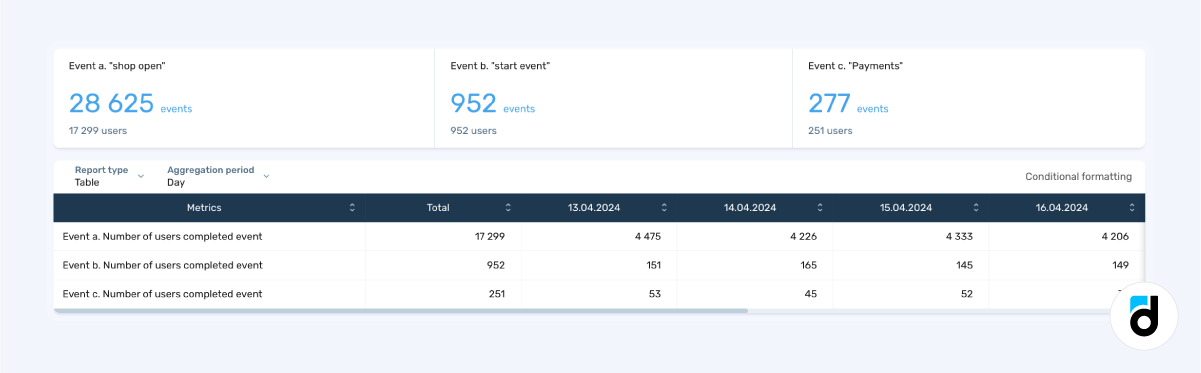
For example, you send an event every time a user enters the in-game store, clicks on an item, buys an item. Based on these events, you can build a funnel and check the conversion rate at each stage in the Conversion Funnel report.
Match-3 games often include additional features such as leaderboards, limited-time events, clans, and daily bonuses that have a significant impact on player engagement and retention. These features provide players with the opportunity to compete, collaborate and earn rewards, thereby enhancing the overall gaming experience.
In devtodev, we can utilize the Retention reports to assess the impact of specific game features on user retention rates. Furthermore, we can employ the User Flow report to visualize the sequence of actions users take within the game.
Analyzing specific user actions via custom events allows for a deeper understanding of player behavior and can inform future development decisions.
Conclusion
Devtodev offers game developers a comprehensive suite of tools for analyzing and optimizing match-3 games. By leveraging these analytics capabilities, you can better understand player behavior, improve game design, and ultimately increase revenue. If you want to take your 3-in-a-row game to the next level and don't know where to start, check out our demo or book a call with a devtodev expert.